
Elementar @ AGU2018 (Booth 1311)

AGU Special Offer
For a limited time only, you can take advantage of an extended 6 months Free Trial of the Elementar ArDB Cloud.
- Create and manage your own private databases
- Collaborate by inviting users to access your private databases and manage their permissions
- Manage samples within your databases
- Draft and publishing features
- Auditing, rollback and versioning features
- Powerful visualizations and statistics
Not ready to register? Then you can still register your interest here to receive a link to register later.
Data Analytics with ArDB
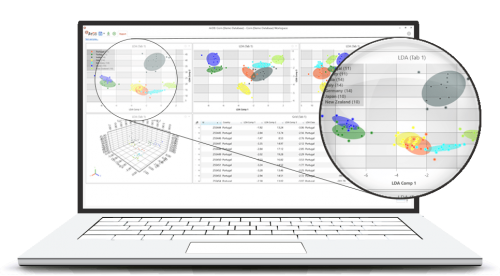
On-board multi-variate analysis
ArDB is able to combine all your analytical results from any type of instrumentation into a single database. With such complex multi-dimensional datasets finding patterns and trends in your data can be challenging.
ArDB has built in support for multi-variate analysis, making it just a few clicks away. Use Principal Component Analysis (PCA) or Linear Discriminant Analysis (LDA) to categorize, score and plot your results easily.
Using the resulting PCA / LDA components, ArDB makes it straight forward to compare any unknown samples against your database of authentic samples.
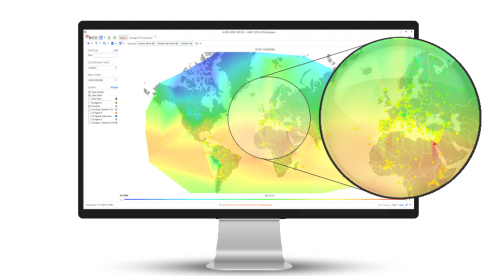
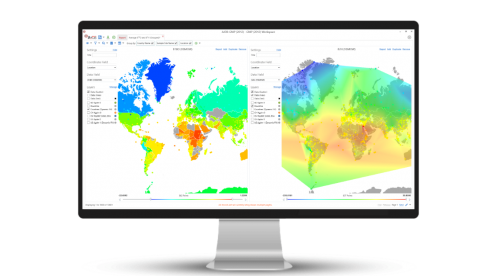
Discover geographic trends in your results
Samples analyzed in the lab may be inherently related to their geopgraphic origin. Being able to easily look for temporal and spatial trends in your data can be essential. ArDB offers powerful Geographical Information System (GIS) features that make this simple.
Once your results are plotted onto a map, data can be quickly aggregated to deliver average values for a given sampling site, or with the Smart Date functionality you can discover temporal trends over any time scale.
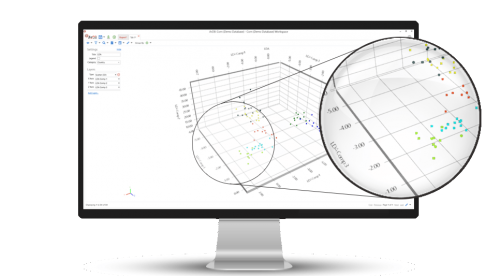
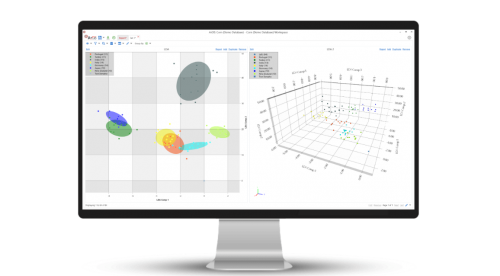
Visualize your data in 3-dimensions
With your results organized in ArDB, it is incredibly simple to begin visualizing your data.
Multiple charts can be plotted instantly and added to the Report page making it simple to see data trends as more samples are submitted to the database.
As well as 2-dimensional plots, ArDB is able to generate 3-dimensional plots which can be rotated, zoomed and panned to make interrogation even simpler, bringing unique perspectives to muti-variate plots.
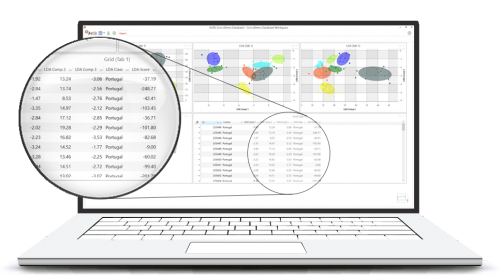
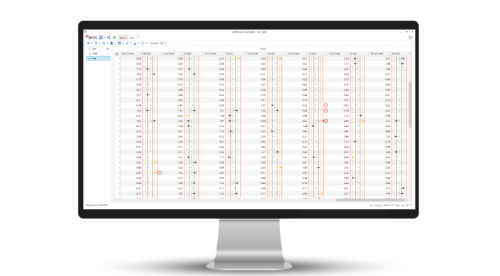
Compare unknown sample results with your database
After generating your comprehensive database of authentic samples, you may want to compare unknown or suspicious samples against them.
ArDB allows analytical results from unknown samples to be easily compared against your known database.
Using the in-built Principal Component Analysis (PCA) or Linear Discriminant Analysis (LDA) functionality, unknown samples can be visually compared as well as categorized with an associated score to provide a statistical evaluation.
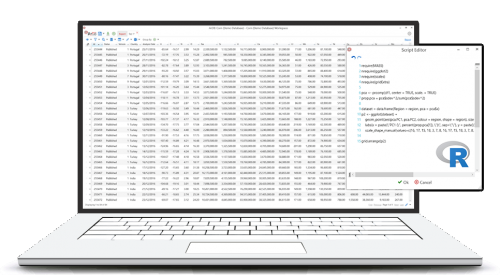
Extend your analytics beyond ArDB
ArDB provides powerful management and analysis tools tools for your analytical results as standard.
Take advantage of the many publicly available R packages and include them in your own customized R scripts that can be executed directly from ArDB to gain extra insights into your data.
Use your favourite statistical packages such as SPSS, Python and Matlab alongside ArDB, by taking your data offline using straight-forward filtering, grouping and sorting featured that get you the data you need faster.
Features
Visualize
Interrogating large databases can be complex and time-consuming. ArDB allows you to quickly group, filter and organize your analytical results, making it simple and fast to visualize your data on 2D Charts, 3D charts, and geographical maps (GIS).
Use Principal Component Analysis (PCA) or Linear Discriminant Analysis (LDA) multivariate statistical techniques to produce informative visualizations that help classify your results.
Statistics
ArDB makes challenging statistical analysis simple, with its intuitive offering of statistical tools (PCA, LDA, etc.).
ArDB supports the running of custom R scripts that extend its default statistical tools offering, allowing you to truly examine your analytical results in any way you choose.
Use in-built filtering and grouping to export your data as XLSX files for use in third-party numerical packages such as Excel or SPSS.
Collaborate
Today’s scientific community is truly global, and collaboration is essential for successful research.
ArDB utilizes a client-server architecture giving remote access to all collaborators whilst maintaining data integrity.
Quality Control
ArDB provides an easy to use mechanism for enabling a full set of Quality Control Statistics calculations and visualizations.
Integration with Elementar Instruments
ArDB directly integrates into your workflow when generating results using Elementar instruments.
Whether performing stable isotope ratio measurements (IRMS) or elemental composition analysis (EA), the calibrated results are directly published to ArDB allowing you to easily build and maintain your analytical results database.
Data Security & Trust
ArDB utilizes a robust security model ensuring that your data is securely stored and transmitted.
Data is only accessible by users with the correct credentials and permissions.
Centralize
ArDB provides a central database for all your analytical results.
Bringing together sample results from any kind of analytical technique (IRMS, ICP-MS, TIMS, etc.) allows you to examine your sample in its entirety using a single solution.